I just received my Raspberry Pi 4 (4GB) from Amazon along with the one and only SanDisk Extreme Pro microSDHC card. Oh and I needed a HDMI to VGA adapter to connect to my Dell Console Switch 2160AS.
Today’s project is a way to monitor my ESXi environment along with UNRAID and the ever-growing Plex environment that started it all. The goal is to be able to monitor my servers and eventually adding some sort of log management tool like Graylog, Spunk, etc.
Setting Up the New Pi
First things first putting it all together. I chose this kit as to me having a fan on something that runs 24/7 just seems like a great idea. Plus it has everything you need minus the memory card.
Putting everything together was a piece of cake and completely toolless! It all just snaps together.
Raspbian Install
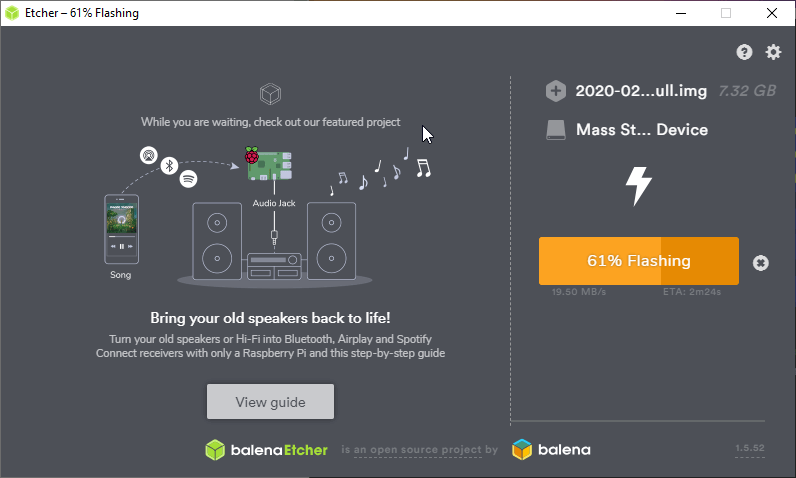
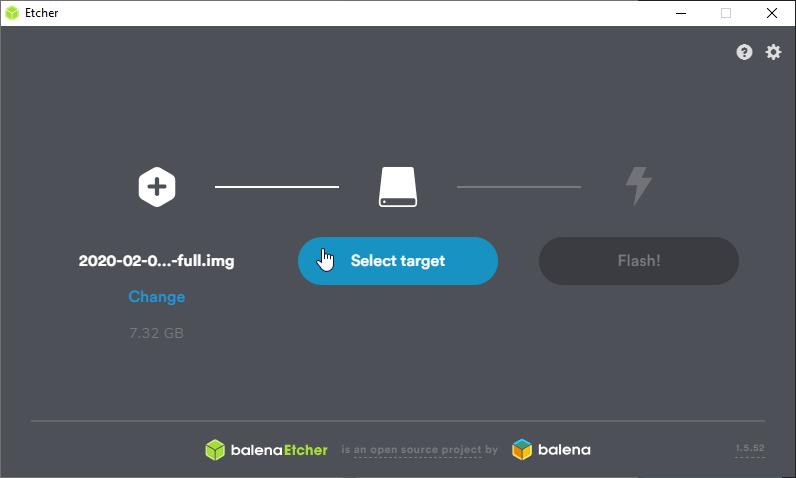
First and foremost you need to grab a copy of Raspbian (OS) to install on your new microSD card. I highly recommend balenaEtcher to flash it. Free handly little utility.
Once complete install the microSD card into your Raspberry Pi and power it on. Go through all the steps, selecting your country, timezone, password, WiFi (if you’re using it), etc. Let it update and reboot.
Once rebooted set a static IP. This will be much more reliable then DHCP. After the network is set up open start (application menu) > Preferences > Raspberry Pi Configuration.
Change the following
- System > Hostname
- Interface > SSH > Enable
- Reboot when complete
After it reboots open up putty on your computer and well configure the rest via putty.
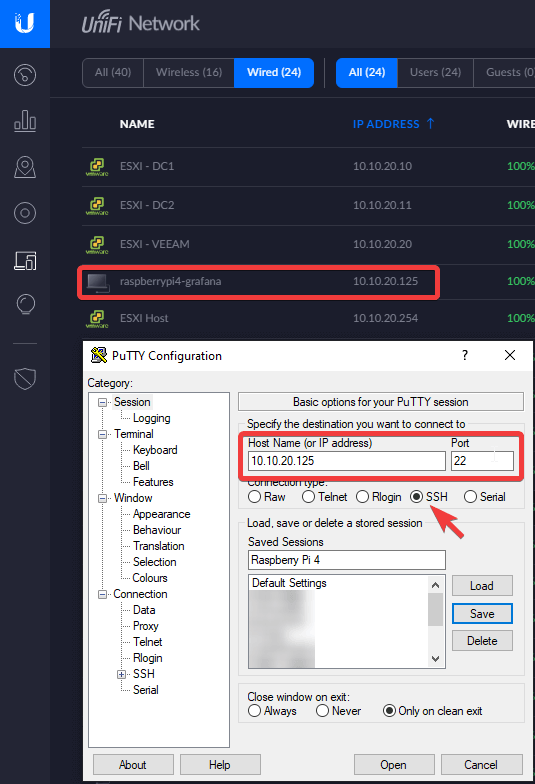
Below you can see in my router my hostname and IP. I’ve set this via my router instead of directly on the client. Put the IP in Putty port 22 via SSH and let’s connect!
Once putty connects, accept the certificate warning and you should have a prompt like this after you put in the password you set when setting up Raspberian.
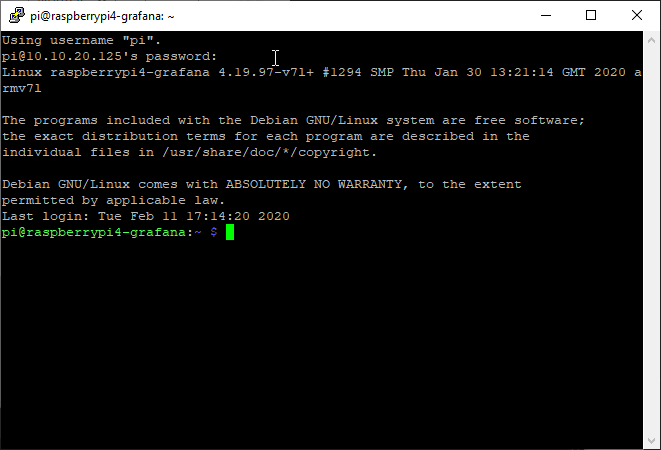
We can now remotely configure the Pi without being at the machine. The next step will be setting up Telegraf, influxDB, and Grafana!
Setting up influxDB
First thing first we need a way to store all our data and influxDB fits this bill. If you closed putty already, reopen it and connect back to the Pi.
- Let’s install the influxDB repository. Copy the text below and right-click in putty to paste it.
wget -qO- https://repos.influxdata.com/influxdb.key | sudo apt-key add -
source /etc/os-release
test $VERSION_ID = "7" && echo "deb https://repos.influxdata.com/debian wheezy stable" | sudo tee /etc/apt/sources.list.d/influxdb.list
test $VERSION_ID = "8" && echo "deb https://repos.influxdata.com/debian jessie stable" | sudo tee /etc/apt/sources.list.d/influxdb.list
test $VERSION_ID = "9" && echo "deb https://repos.influxdata.com/debian stretch stable" | sudo tee /etc/apt/sources.list.d/influxdb.list
2) Install influxDB from the repository we just added:
sudo apt-get update && sudo apt-get install influxdb
3) Now, let’s start the service:
sudo service influxdb start
4) Configuration – inlfuxDB has now been installed with the defaults but needs a configuration file. Use the command below to point it:
influxd -config /etc/influxdb/influxdb.conf
5) Lets set the variable INFLUXDB_CONFIG_PATH to the path of the configuration file.
echo $INFLUXDB_CONFIG_PATH /etc/influxdb/influxdb.conf
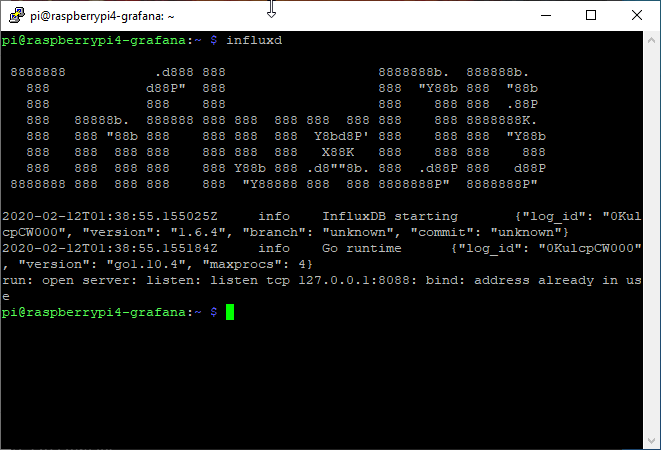
6) Start the service and see if it works!
influxd
7) Let’s configure influxDB
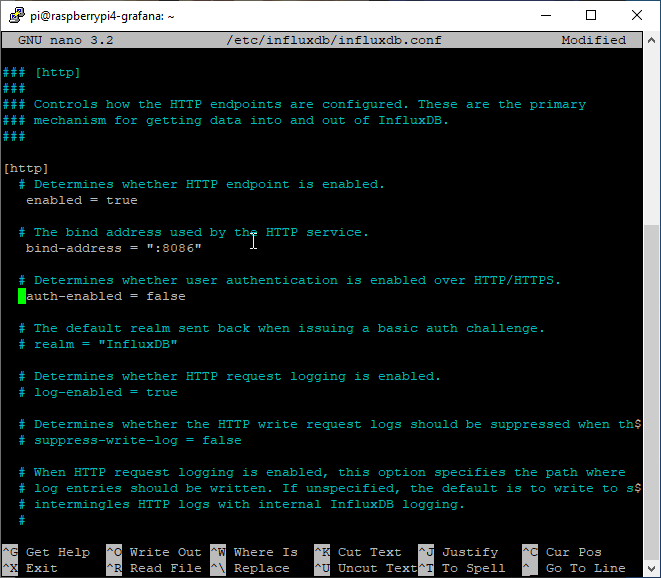
sudo nano /etc/influxdb/influxdb.conf
8) Scroll down (down arrow key) till you find [http] and uncomment the following below. They should change color.
- enabled = true
- bind-address = “:8086”
- auth-enabled = false
Press Ctrl + X
Then y for yes
Enter to write the file
9) Restart influxDB since we made modifications to the config.
sudo service influxdb restart
To verify its working we should be getting a “404 page not found error“. To test this if your own your raspberry pi put localhost:8086 in your web browser. If you’re on a remote machine like myself you’ll need to replace localhost with the raspberry pi IP. Mine would be 10.10.20.125:8086
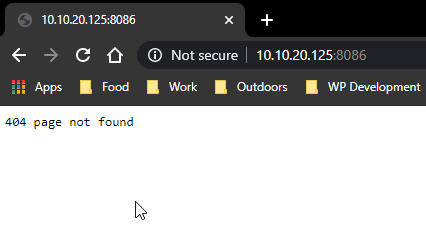
Perfect that’s exactly what we want to see! One more step.
10) Let’s install the influxdb-client to use CLI.
sudo apt install influxdb-client
After that, we should be able to type influx > SHOW DATABASES and list the databases and exit when done.
SUCCESS WE DID IT! Next up we need to fill that database with some sweet sweet data! Let’s install telegraf.
Telegraf – Collecting the data
Telegraf is a server agent that collects metrics from your sensors and systems. Each agent will send data to a new database in influx which we can then pull together in Grafana.
Download link for updated versions can be found here: https://portal.influxdata.com/downloads
Back to putty. Let’s find out which version of Debian we’re running.
cat /etc/debian_version
I’m on 10.3 so from this list I will use 10 Buster and put the command in:
wget -qO- https://repos.influxdata.com/influxdb.key | sudo apt-key add -
source /etc/os-release
##### PICK THE ONE THAT MATCHES YOUR VERSION and run it without the $  #####

# Debian 7 Wheezy
$ test $VERSION_ID = "7" && echo "deb https://repos.influxdata.com/debian wheezy stable" | sudo tee /etc/apt/sources.list.d/influxdb.list

# Debian 8 Jessie
$ test $VERSION_ID = "8" && echo "deb https://repos.influxdata.com/debian jessie stable" | sudo tee /etc/apt/sources.list.d/influxdb.list

# Debian 9 Stretch
$ test $VERSION_ID = "9" && echo "deb https://repos.influxdata.com/debian stretch stable" | sudo tee /etc/apt/sources.list.d/influxdb.list

# Debian 10 Buster
$ test $VERSION_ID = "10" && echo "deb https://repos.influxdata.com/debian buster stable" | sudo tee /etc/apt/sources.list.d/influxdb.list
Now telegraf is added to our distributions. Let install it!
sudo apt-get update
sudo apt-get install telegraf
sudo wget https://dl.influxdata.com/telegraf/releases/telegraf-1.13.3_linux_armhf.tar.gz
Telegraf should run automatically but just to be sure it start:
sudo systemctl start telegraf
Great, now its set to actually start and has been installed. Let’s configure it so it knows where to send the data it collects.
sudo nano /etc/telegraf/telegraf.conf
Scroll down until you find the OUTPUT PLUGINS section. We need to uncomment a few items. Delete the # in front of
- urls = [“http://127.0.0.1:8086”] (Change the IP if you are installing this on a different client other then the host)
- database = “telegraf” (Change to match the device name. You’ll want to do this for each telegraf agent so they are not all writing to the same database. Mines called “rasppi4-grafana”
- timeout = “5”
Ctrl + x once done, yes, then enter.
Now restart the telegraf service
sudo systemctl restart influxdb
Data should now be flowing into the influxdb database called ” rasppi4-grafana” in my case
Grafana Setup and Install
Now the really fun part where it’s going to look amazing!
echo "deb https://packages.grafana.com/oss/deb stable main" | sudo tee /etc/apt/sources.list.d/grafana.list

wget -q -O - https://packages.grafana.com/gpg.key | sudo apt-key add -

sudo apt-get update
sudo apt-get upgrade

sudo apt-get install apt-transport-https

sudo apt-get install grafana

sudo update-rc.d grafana-server defaults


sudo systemctl daemon-reload
sudo systemctl start grafana-server
Grafana is now installed and set to run automatically.
In your browser see if you can load the web inteface
- From the Raspberry Pi you can put in the URL http://localhost:3000
- Remote computer http://IPADDRESS_HERE:3000
Default Login is: admin/admin and set new master password.
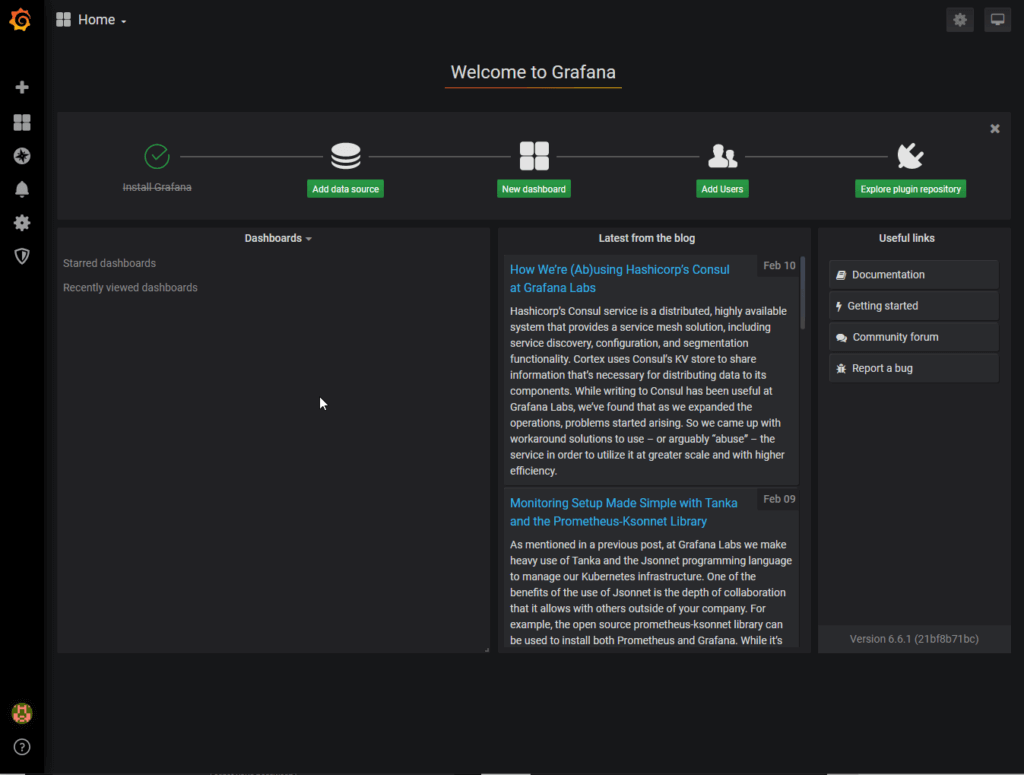
If all went well you should now be at the welcome screen. Let contine to add influx.
- Click “Add data source”
- Select Influx
- Fill out the following fields
- Name – What will show in Grafana
- URL: http://localhost:8086 or replace localhost with the IP of the raspberry pi
- Database: We created this earlier when we setup telegraf. If you forget, you can always put in putty > influx > SHOW DATABASES.
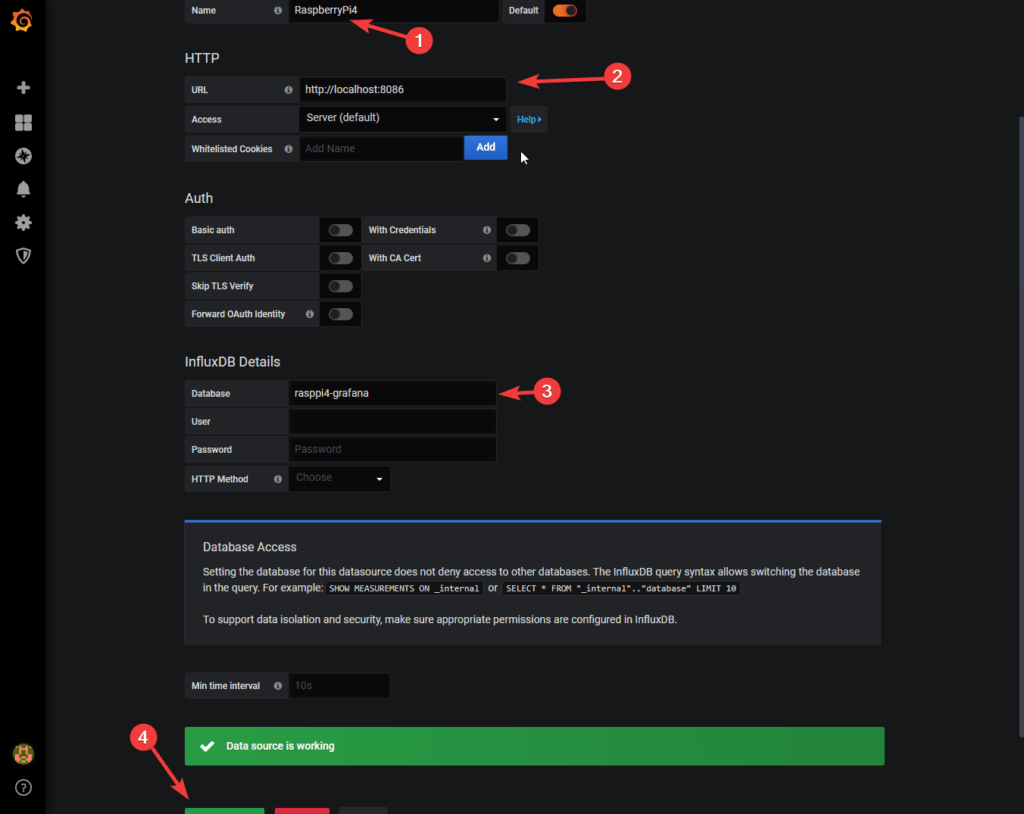
Once if all went well you have a nice big green banner across the bottom saying “Data source is working”
Now we need a Dashboard to present the data. Lets use this one even though it not perfect. We just want to check to make sure data is flowing.
https://grafana.com/grafana/dashboards/10578
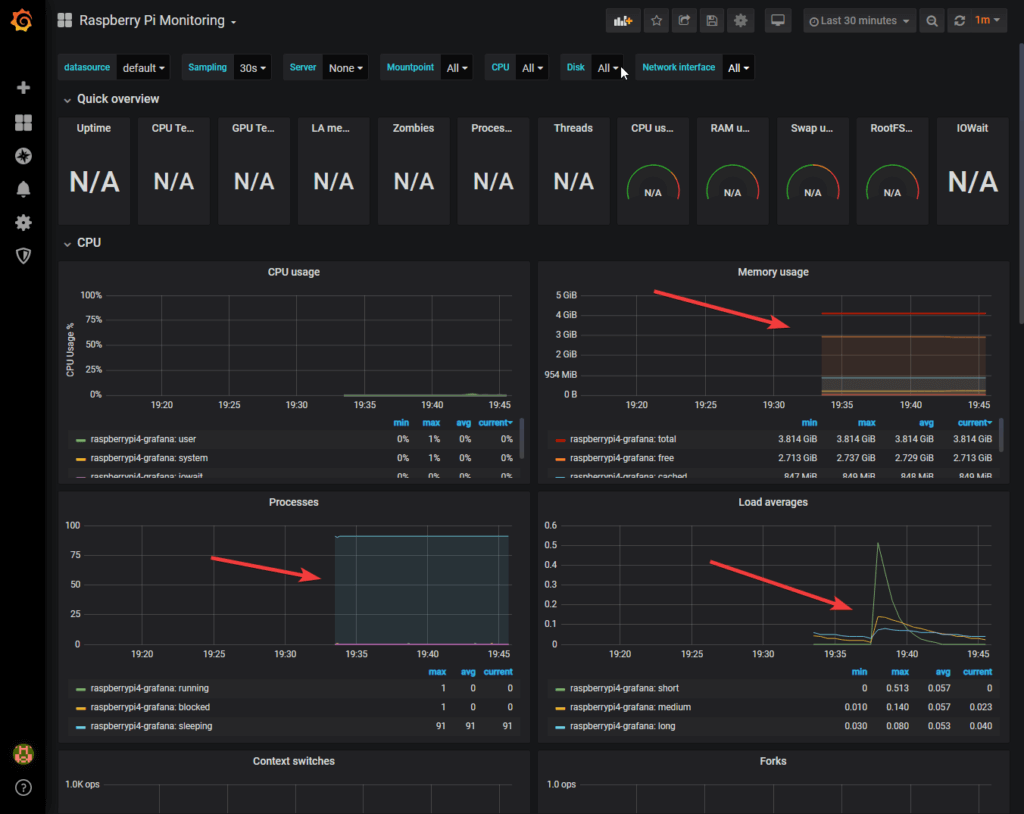
On the left of the page hover over the + and select import. Put the dashboard ID in (10578) and click load. Feel free to rename it if you wish and select the telegraf database. Now Import!
We can see data is definitely being written.
Now let’s get UNRAID logging and into Grafana!
To do this we need to install the telegrapf agent on our UNRAID server. We are going to be using this dashboard: https://grafana.com/grafana/dashboards/7233
There are a few prerequisites with this dashboard so be sure to install them also if you want to completely fill in everything.
In UNRAID visit the Apps tab and search for “telegraf” and install it.
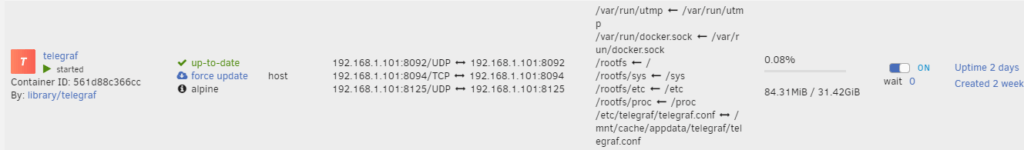
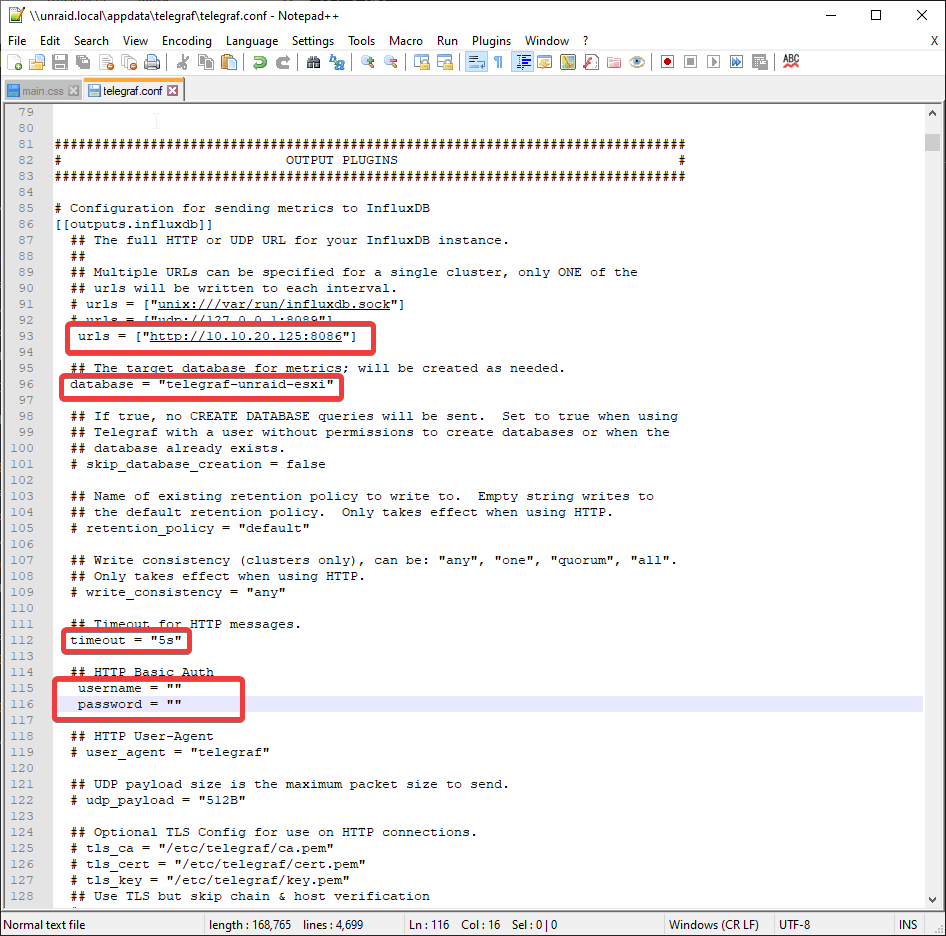
Browse to the appdata folder in UNRAID and find the telegraf folder. Inside should be telegraf.config We need to configure this exactly the same way we did earlier so it points to our raspberry pi.
Edit the file and uncomment and edit the fields. Make sure the URL field is the IP of your raspberry pi.
One done, save it and restart the app!
If we go back to putty and put in influx then SHOW DATABASES we should see our new database.
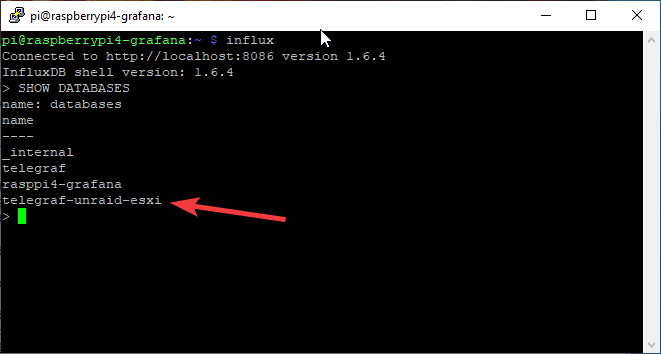
Data is now flowing into influx! Let’s install another dashboard in Grafana to display it! For this one I prefer https://grafana.com/grafana/dashboards/7233
Follow the same steps we did earlier to import the Raspberry Pi Dashboard. Please note there are some other requirements in order for all fields to be displayed so read over the dashboard page.
Now that the dashboard is installed and loaded its missing the UNRAID influx database. We need to set it up in Grafana.
In Grafana go to Settings > Data Sources > Add data source.
Select influxDB again and fill it out again with the raspberrypi ip for the URL and the new database name. Mine is “telegraf-unraid-esxi” This was defined in the telegraf.config file in the app on UNRAID.
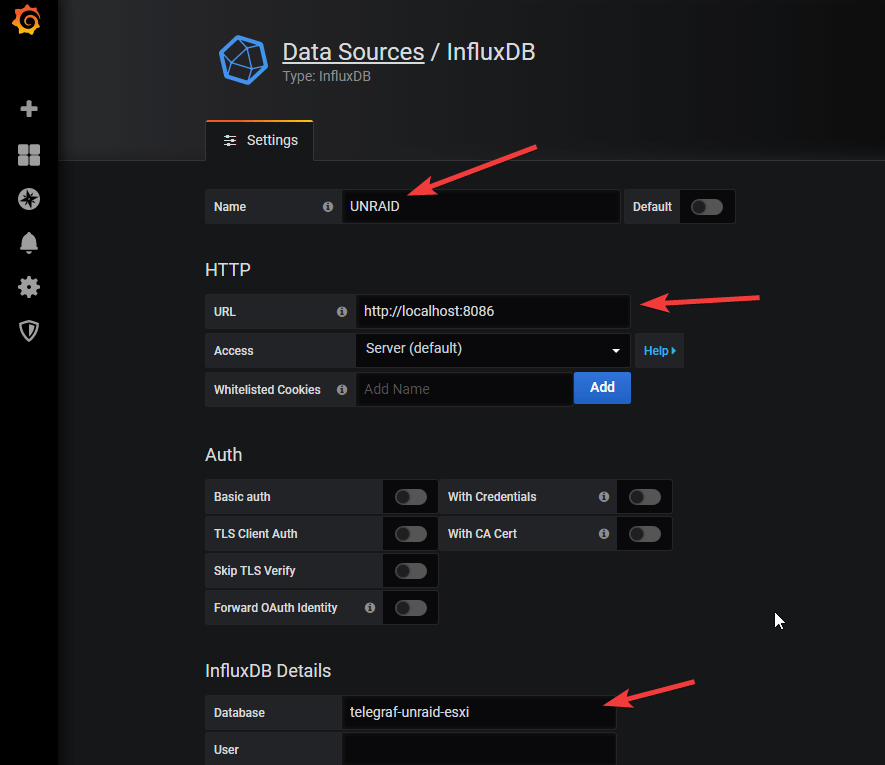
Save and Test. It should be a nice big green bar!
Head on back over to your dashboards and check out the “Unraid System Dashboard”